USD/CAD Price Analysis: 1.2870/75 guards immediate upside
- USD/CAD bears catch a breather around May 2018 lows.
- An upside break of immediate falling channel favors corrective pullback.
- 100-HMA, weekly resistance line probe the bulls, bears can eye for 1.2730.
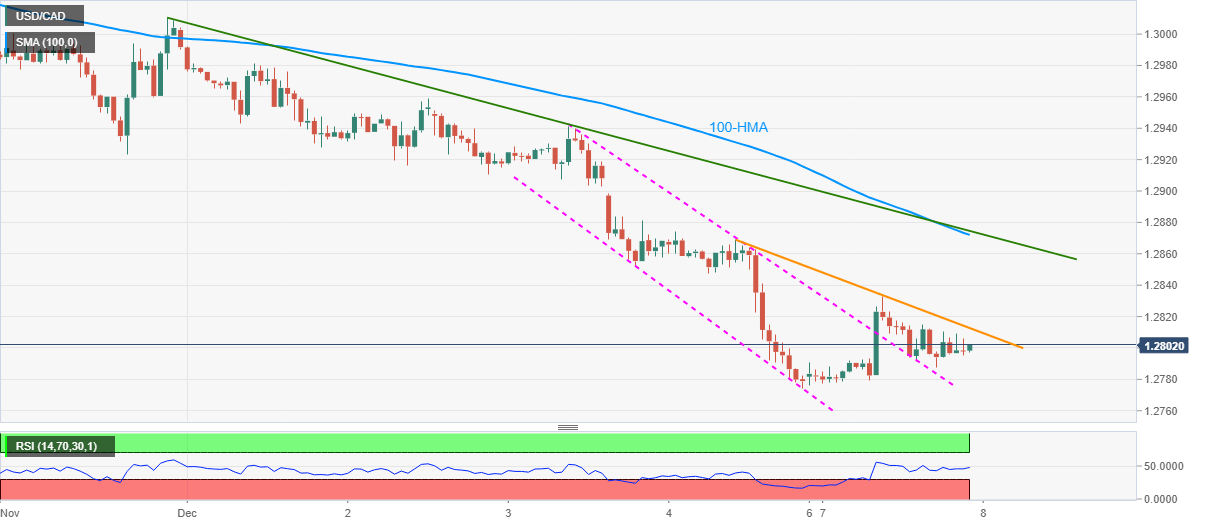
USD/CAD seesaws around 1.2800 during the early Asian session on Tuesday. The pair recently bounced off the lowest since May 22, 2018, after breaking a three-day-old falling trend channel.
However, an immediate resistance line from Friday, at 1.2812 now, restricts the quote’s retracement by press time amid normal RSI conditions.
Even if the USD/CAD buyers manage to cross the 1.2812 immediate upside hurdle, a joint of 100-HMA and a falling trend line from November 30, near 1.2870/75, becomes a tough nut to crack for them.
Meanwhile, the recent low near 1.2770 and the May 2018 bottom surrounding 1.2730 are likely to lure the USD/CAD bears during the fresh downside.
In a case where the pair ignores likely oversold RSI conditions around 1.2730, the 1.2700 round-figure and multiple tops near 1.2625/20 may gain market attention.
USD/CAD hourly chart
Trend: Bearish