Back
14 Jul 2020
US Dollar Index Price Analysis: Potential test of the 96.00 area
- DXY remains under pressure amidst prevailing risk-on trends.
- Further declines now expose the Fibo level in the 96.00 zone.
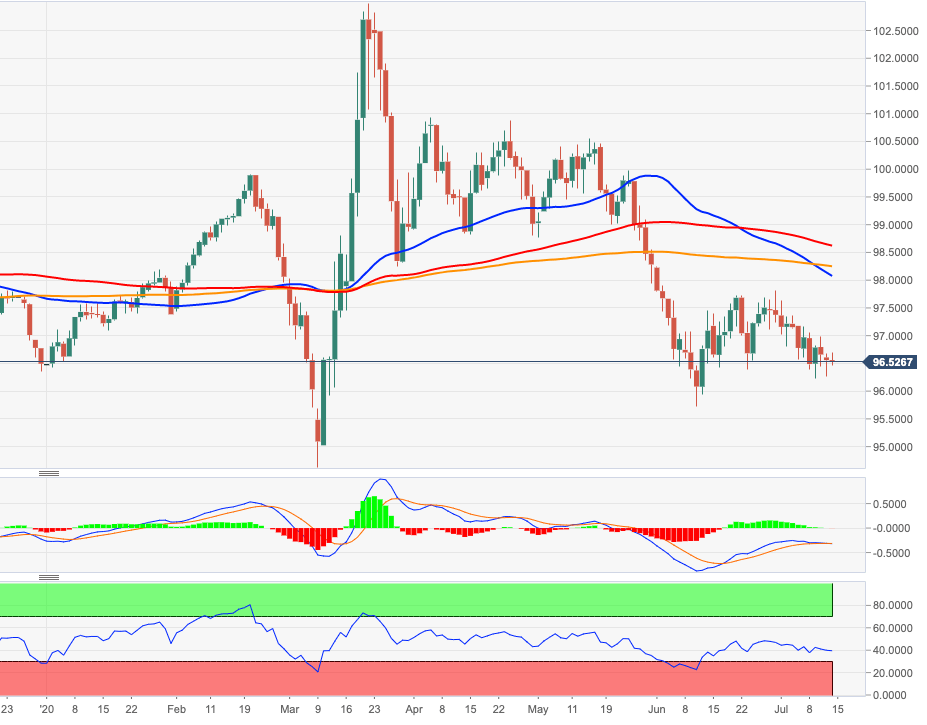
DXY is alternating gains with losses in the 96.60 region on Tuesday, always against the backdrop of solid risk appetite trends favouring the risk complex.
The continuation of the decline is predicted to put the Fibo level (of the 2017-2018 drop) just above 96.00 to the test ahead of a potential leg lower to June’s low at 95.71.
The negative outlook on the dollar is expected to remain unaltered while below the 200-day SMA, today at 98.24.
DXY daily chart