Back
9 Mar 2020
AUD/USD Price Analysis: Confirms short-term rising wedge
- AUD/USD confirms bearish chart formation, signals further downside to a fresh 11-year low.
- 200-bar SMA acts as the immediate upside barrier, 0.6545 may act as nearby support.
AUD/USD drops to 0.6605 amid the initial trading session on Monday. In doing so, the Aussie pair confirms the short-term bearish technical pattern.
While theory suggests the Aussie pair’s further downside towards fresh 11-year low, 50% and 38.2% Fibonacci retracements of February 12-28 downside, respectively around 0.6590 and 0.6555, can please short-term bears.
Also challenging the sellers will be horizontal support around 0.6550/45 as well as 23.6% Fibonacci retracement level near 0.6505.
On the upside, the support-turned-resistance around 0.6625 and 200-bar SMA close to 0.6680 can question the immediate buyers.
If at all the quote rallies beyond 0.6680, 0.6710 and 0.6750 will be on the bulls’ radars.
AUD/USD four-hour chart
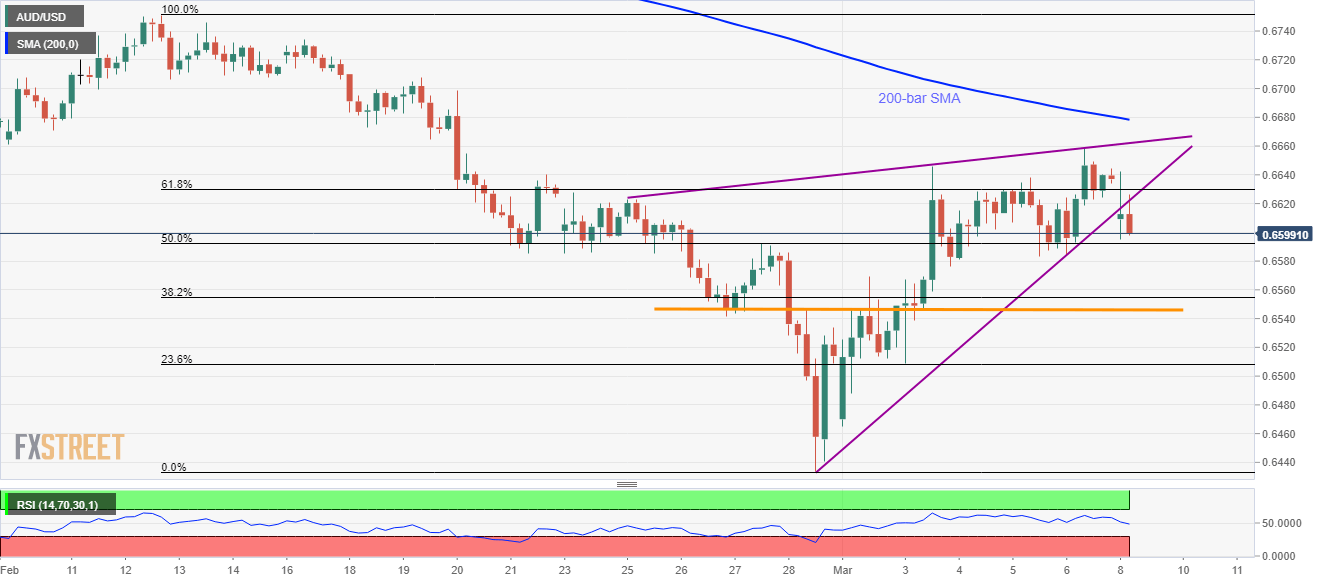
Trend: Bearish