AUD/JPY technical analysis: 50-bar EMA, 61.8% Fibo. cap immediate downside
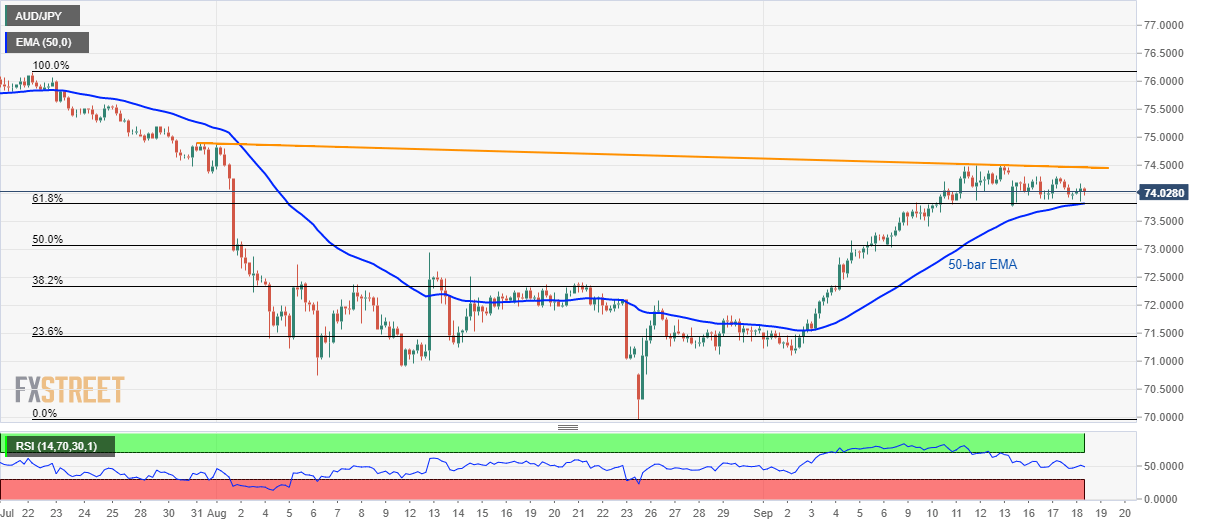
- AUD/JPY stays above 73.80/82 support confluence including 50-bar EMA and 61.8% Fibonacci retracement.
- A falling trend-line since July-end restricts nearby upside.
Despite showing fewer moves off-late AUD/JPY stays well above key support-confluence while flashing 74.00 as a quote during the early Asian session on Thursday.
The 50-dar exponential moving average (EMA) and 61.8% Fibonacci retracement of July-August declines together constitute 73.82/80 support-joint that becomes the key for sellers to watch as a downside break of which could drag the quote to September 10 low near 73.42 before highlighting 50% Fibonacci retracement level of 73.07 for bears to watch.
It should, however, be noted that August 13 top surrounding 72.90 could restrict the pair’s declines below 73.07.
Alternatively, a downward sloping trend-line since July 31, near 74.50, acts as an immediate resistance, a break of which can escalate the run-up towards 75.00 and July 25 high close to 75.60 whereas July month peak around 76.20 could lure bulls afterward.
AUD/JPY 4-hour chart
Trend: sideways