Back
17 Sep 2019
US Dollar Index technical analysis: DXY loses steam, trades below the 98.42 level
- The Greenback is losing steam this Tuesday as the bears broke below the 98.42 level.
- Investors will closely be watching the FOMC on Wednesday.
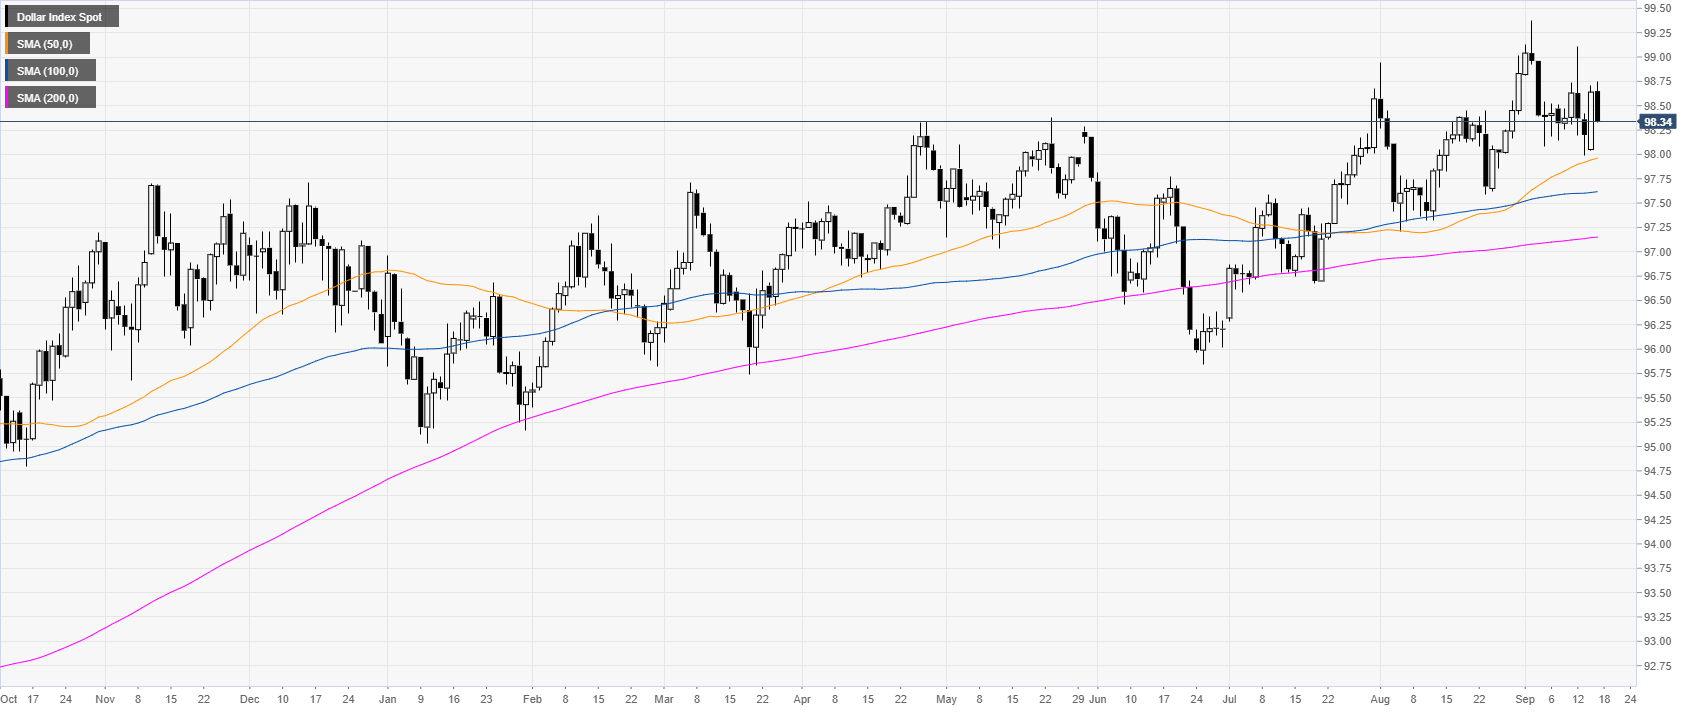
DXY daily chart
DXY (US Dollar Index) is in a bull trend above the main daily simple moving averages (DSMAs). DXY is losing momentum this Tuesday. Traders will be on the lookout on Thursday with the FOMC.
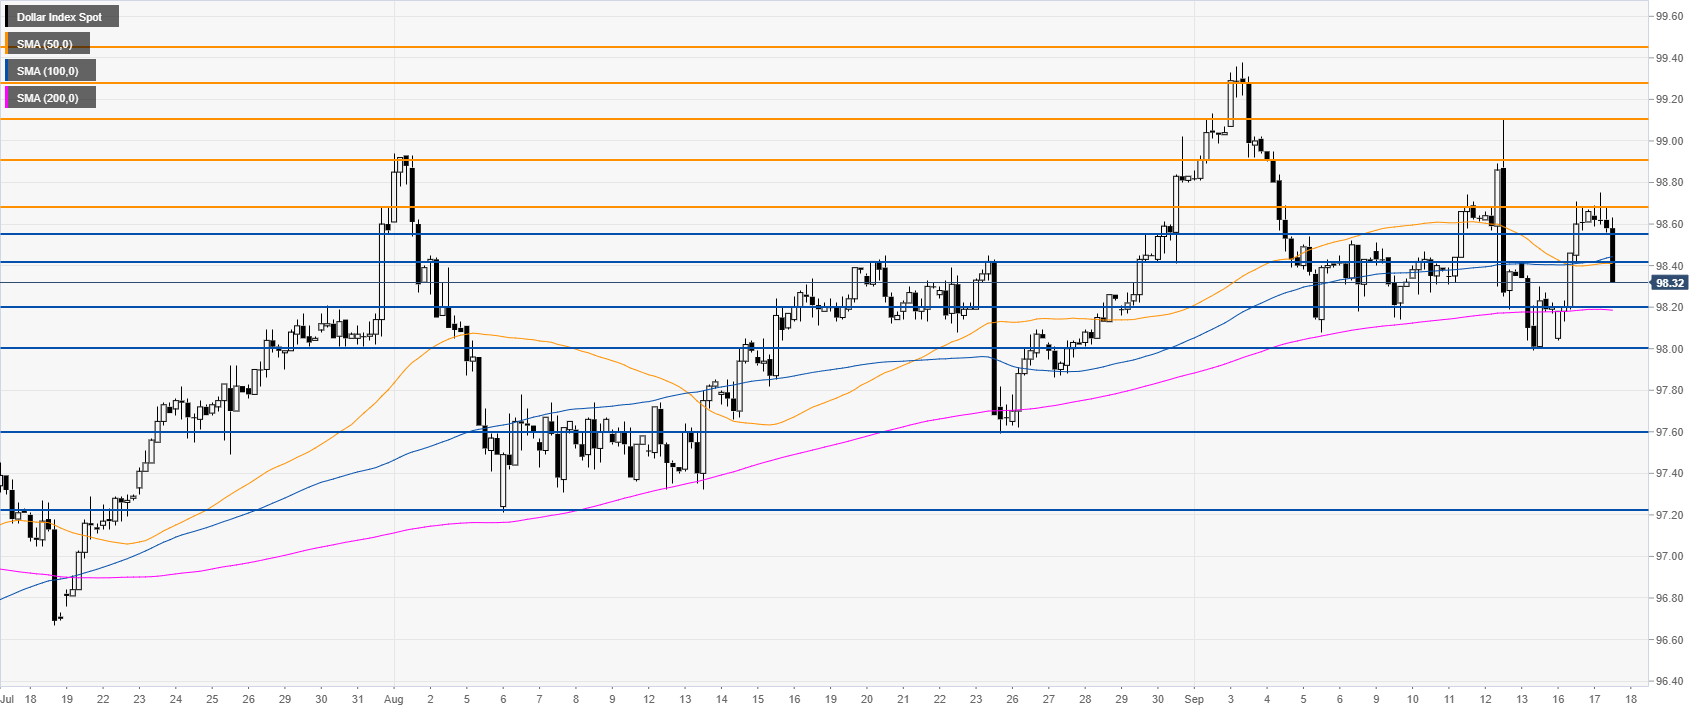
DXY four-hour chart
DXY is trading below the 50/100 SMAs, suggesting a consolidation in the medium term. The market seems to be headed towards 98.20 resistance and the 200 SMA.
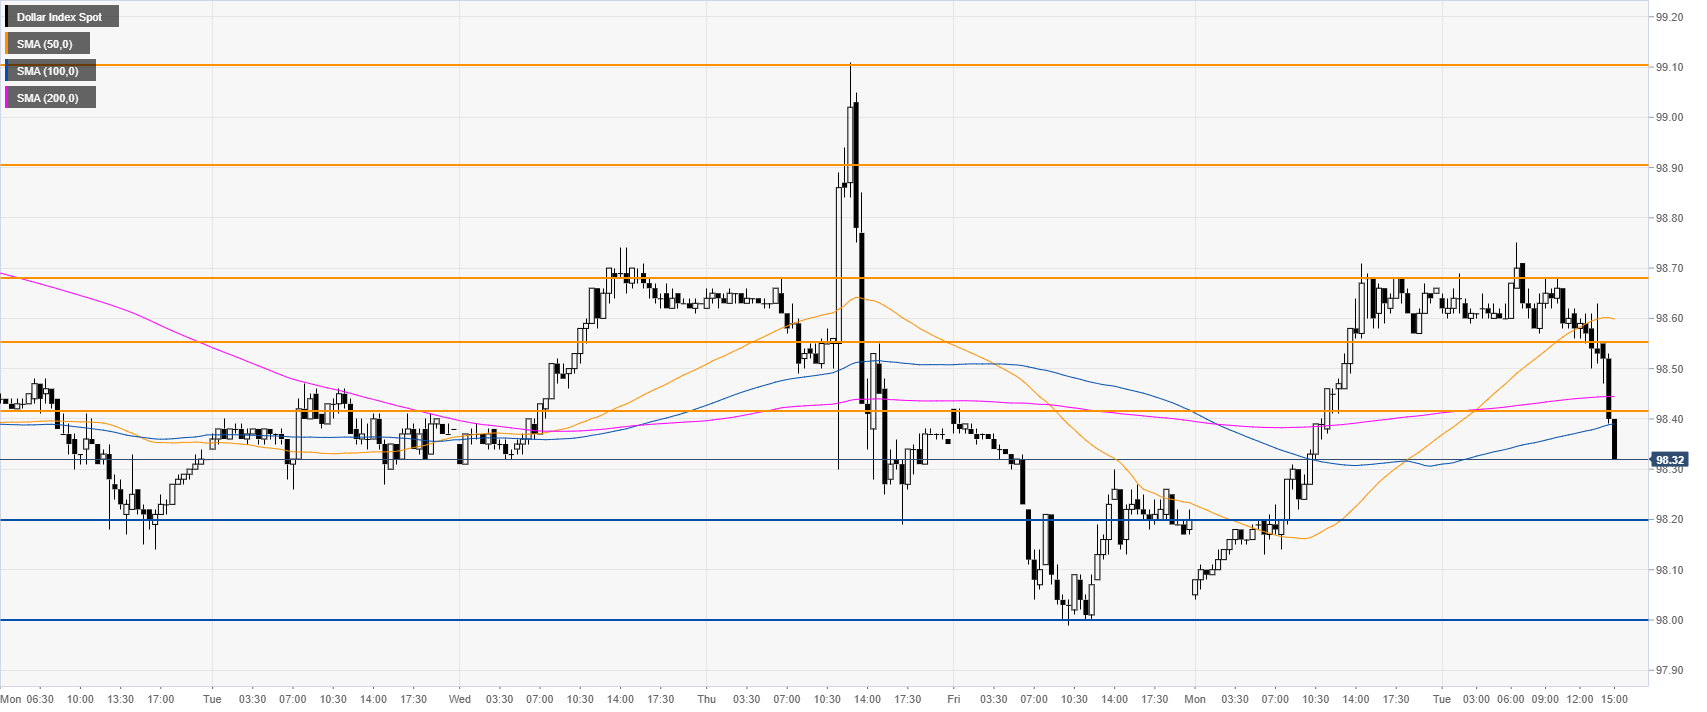
DXY 30-minute chart
DXY is trading below the main SMAs, suggesting a bearish momentum in the near term. Immediate resistances can be seen near 98.42 and 98.55 price levels.
Additional key levels