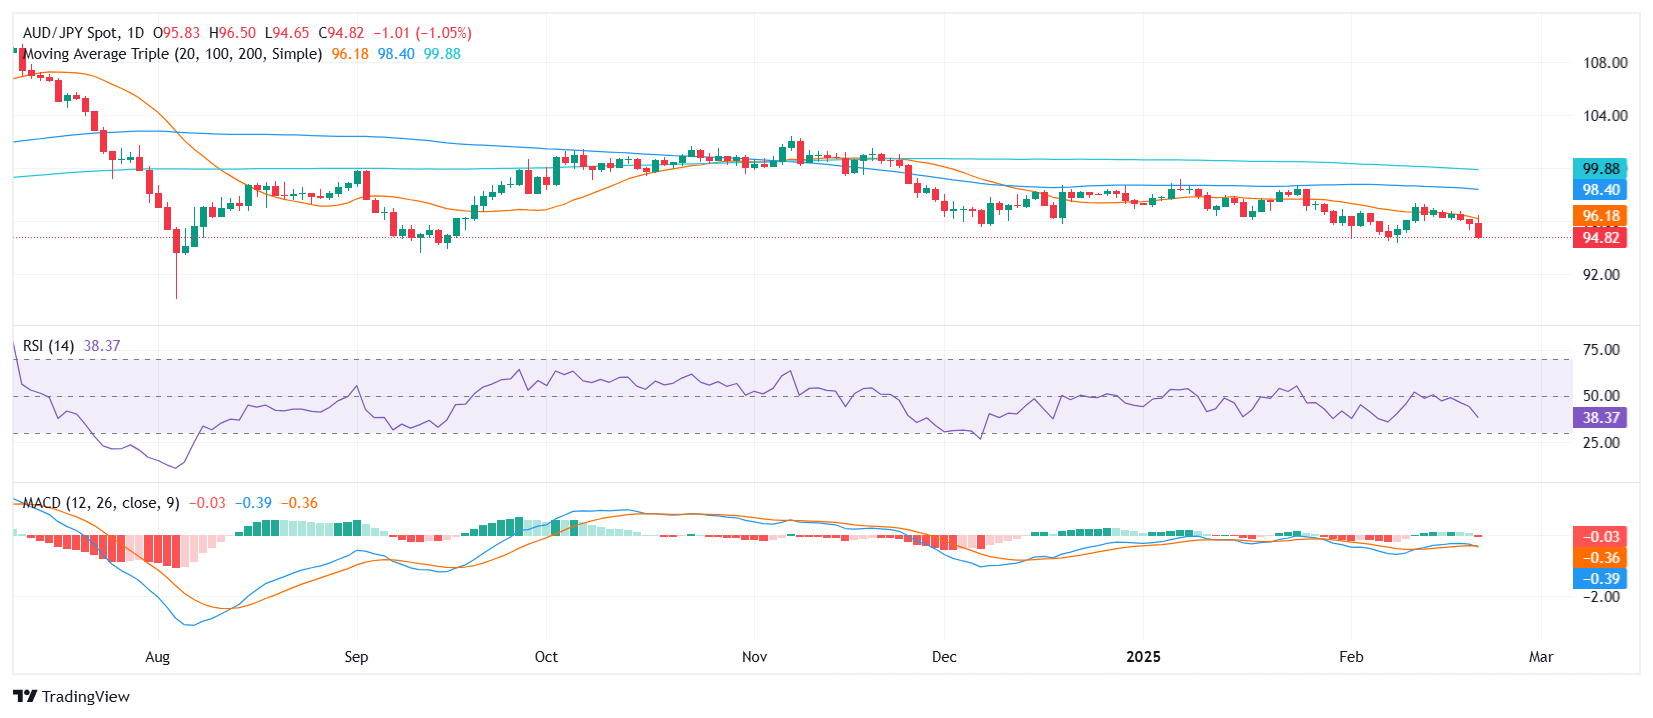
AUD/JPY Price Analysis: Bears deepen losses as pair hits multi-week lows
- AUD/JPY extends its decline, falling sharply and breaking below the 20-day SMA.
- RSI remains in negative territory, reflecting intensifying bearish momentum.
- MACD histogram prints rising red bars, signaling increasing downside pressure.
The AUD/JPY cross continued its downward trajectory on Friday to around 94.80, posting sharp losses and breaking through key technical support levels. The pair now trades at its lowest level in over two weeks, signaling that bears have taken firm control. The sustained drop below the 20-day Simple Moving Average (SMA) highlights the shift in market sentiment, with sellers dominating the current trend.
Technical indicators reinforce the negative outlook. The Relative Strength Index (RSI) has plunged deeper into negative territory, suggesting that bearish momentum is accelerating and that the pair could remain under pressure in the near term. Meanwhile, the Moving Average Convergence Divergence (MACD) histogram is showing rising red bars, signaling growing downside momentum as sellers continue to gain ground.
Looking ahead, unless the pair stages a strong recovery back above the 20-day SMA, the bearish outlook is likely to persist. The next support zone could emerge around the 94.50 area, while any attempt at recovery would likely face resistance near the 20-day SMA near 96.00. A decisive break above this level would be needed to shift sentiment and provide buyers with a foothold, though for now, the bears remain in command.

