


What are support and resistance levels?
Advantages of using support and resistance indicators
Top support and resistance indicators
Support and resistance strategies
Support and resistance levels help Forex traders make more informed decisions. They represent price zones that influence the market movement, determining where the price can slow down, roll back, or continue the trend. How do we identify these critical price zones? It's simple: on the chart, you can see particular indicators demonstrating specific market changes. Each support and resistance indicator has unique characteristics and can be used in different trading conditions. In this article, we'll analyse the most popular indicators and their effectiveness and give practical recommendations on how to use them.
What are support and resistance levels?
Support and resistance levels are the key concepts in technical analysis. They help traders identify potential pivot points on price charts.
The support level is a price zone where the market tends to bounce during a bearish trend. At this point, market participants are likely to start buying in anticipation that the support level will hold.
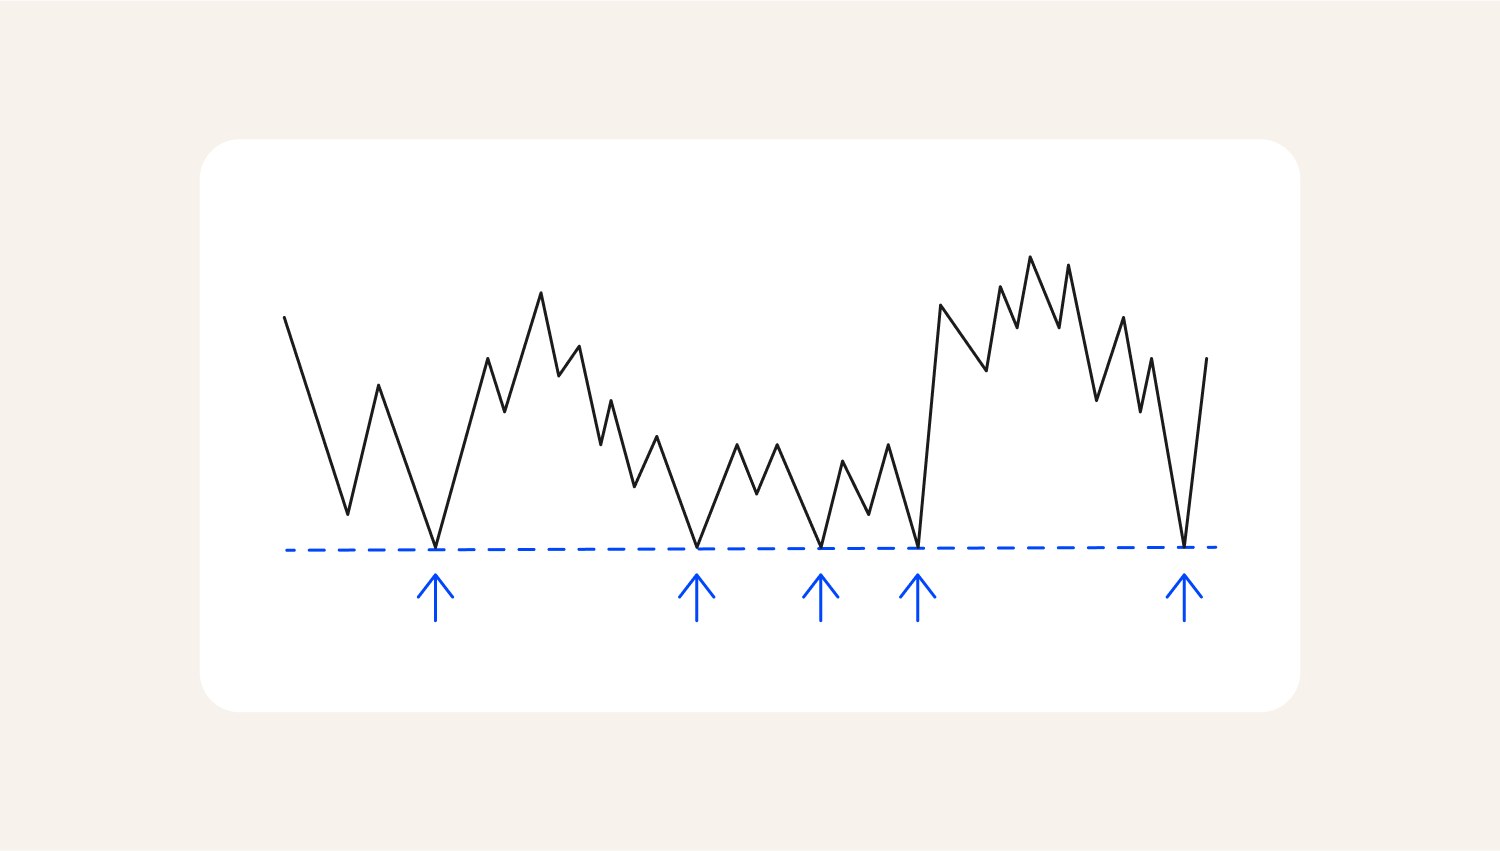
Support level
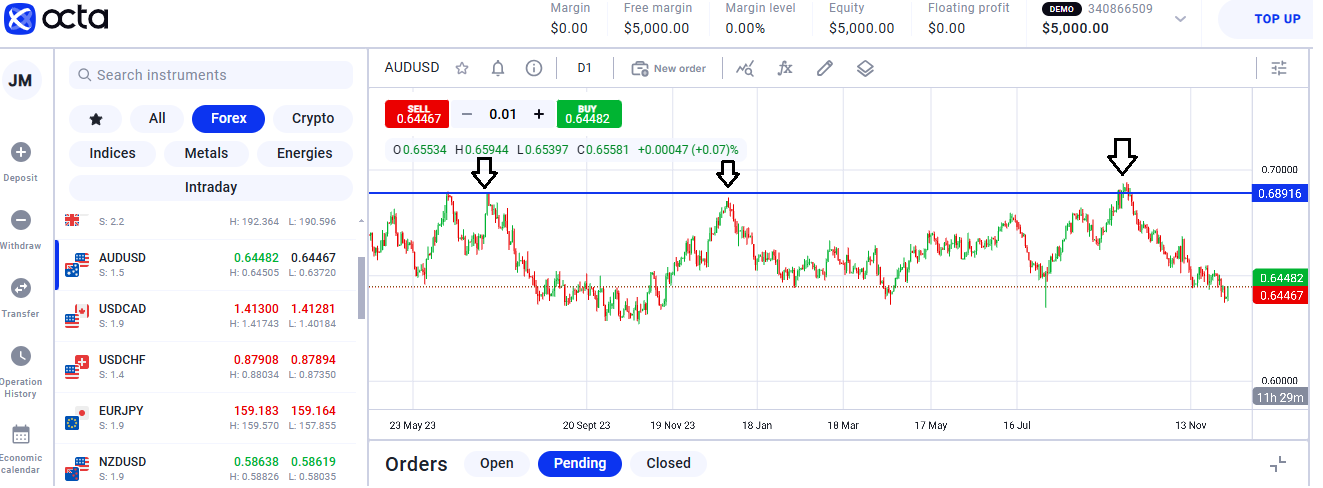
A resistance level is a price zone where the market struggles to break through during a bullish trend. It represents an area of high supply, where sellers outnumber buyers, preventing further price increases.
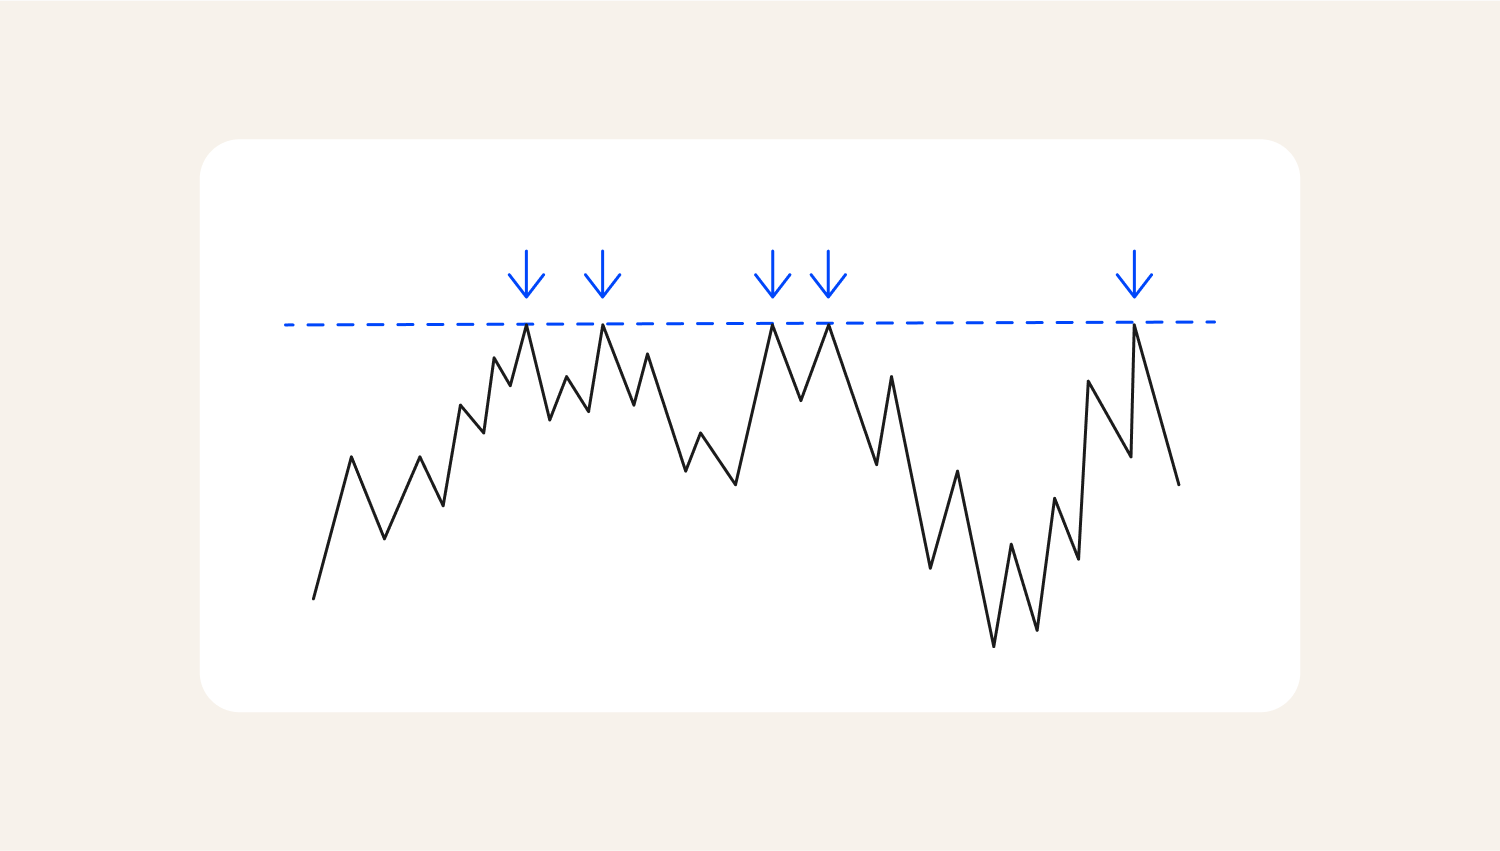
Resistance level
The resistance and support levels are drawn horizontally and can be in the form of trend lines. That is, they can form a price channel that traders pay attention to. The examples above and below show the support and resistance trends.
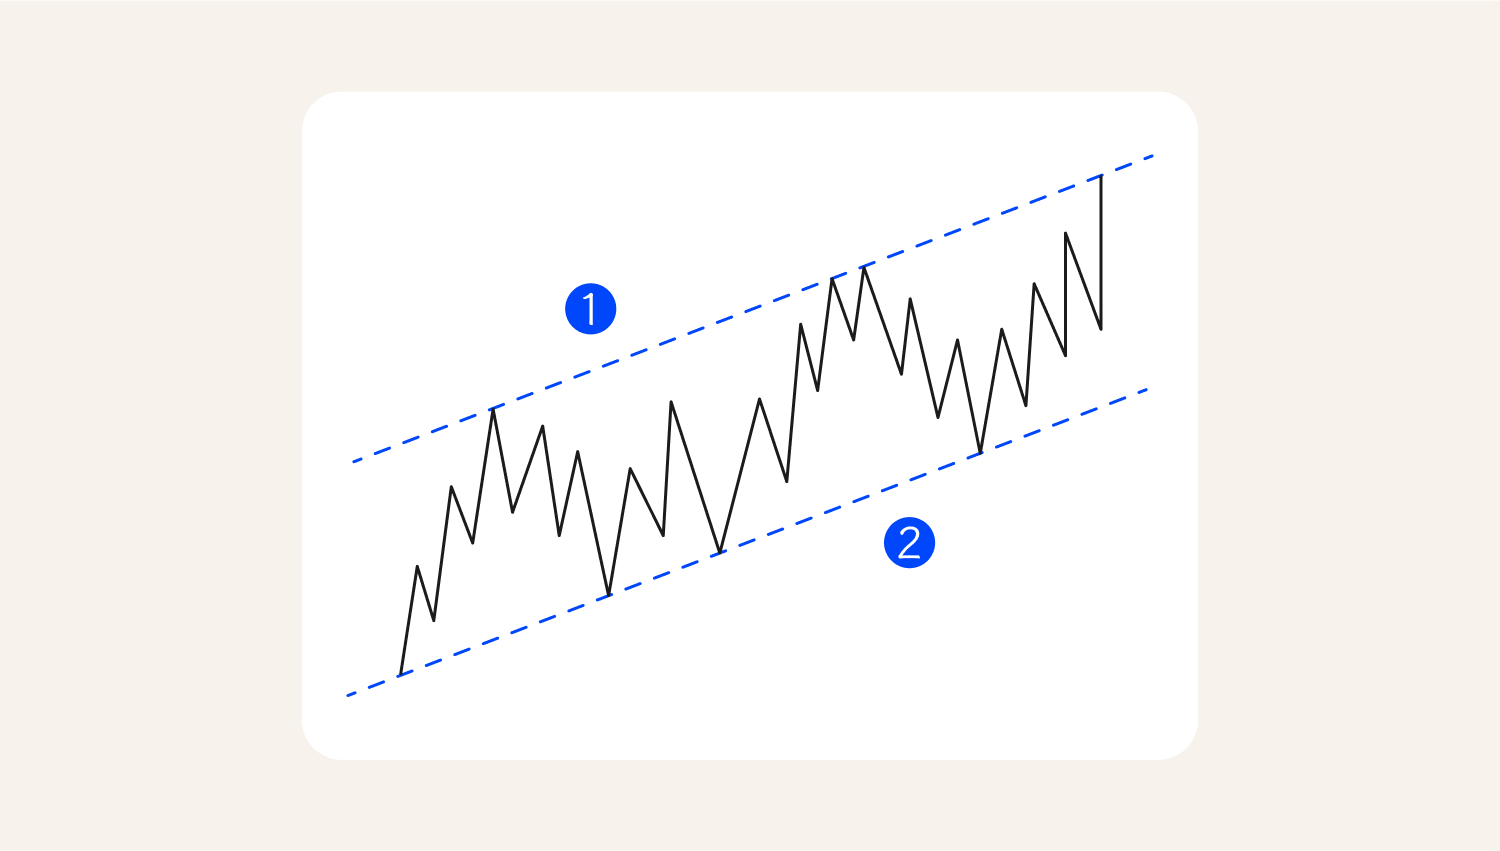
To draw support and resistance levels, a trader needs more than two points where the price has previously reacted. The more points that align, the more reliable these levels become.
Advantages of using support and resistance indicators
Traders, both newbies and experienced, use support and resistance zones as the primary reference points to help them plan where they can open and close positions.
The Forex market is always in a state of uncertainty and volatility. Therefore, it requires fundamental analysis. By detecting support and resistance indicators, you can:
- Get accurate signals for entering and exiting the trades. For example, a rebound from the support level may be perceived as a buy signal, and a failure to penetrate a resistance level as a sell signal.
- Manage risks. Place stop-loss orders below the support level or above the resistance level. You'll protect your capital from significant losses in the case of price changes.
- Evaluate market sentiment. Observing the asset price within the concept of support and resistance levels gives you a clear vision of the market dynamics. Suppose the price bounces repeatedly off the support level. In that case, this indicates that the forces of buyers prevail over the forces of sellers. At the same time, frequent breakouts of resistance levels demonstrate the growing influence of sellers.
Traders who use support and resistance indicators significantly increase the success rate of their trades.
Top support and resistance indicators
There's no universal indicator that would help all traders at once. To choose the appropriate option for your needs, consider market liquidity, volatility, and the type of asset you are trading.
The most popular indicators are described below.
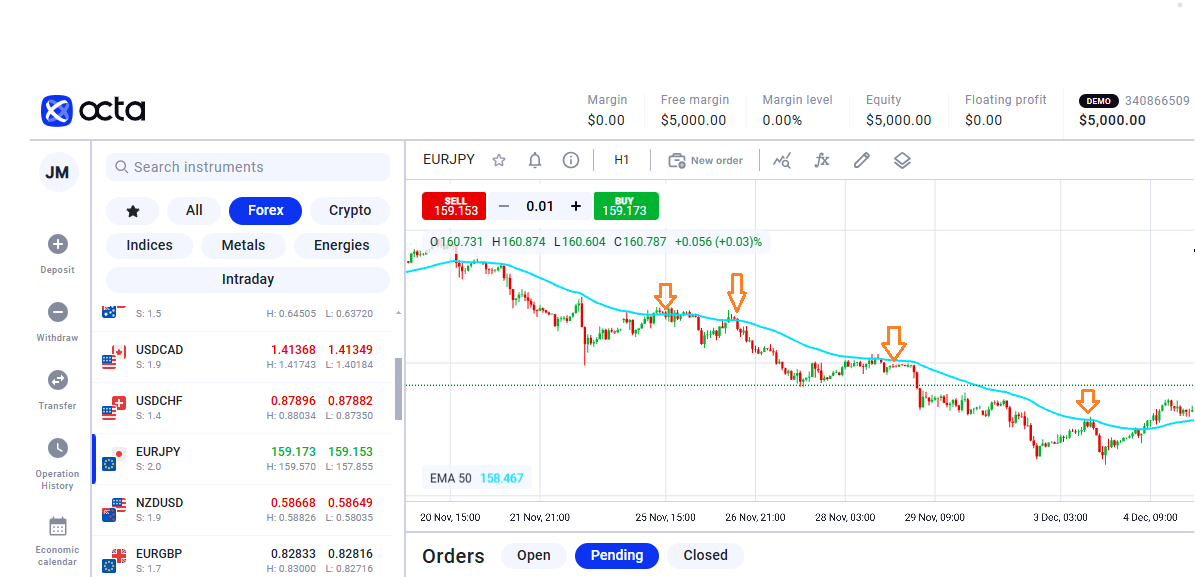
Moving Averages
The Moving Average represents the average price of an asset over a certain period. There are two most common types of this indicator:
- Simple Moving Average (SMA) represents price movement over a specific period.
- Exponential Moving Average (EMA) applies to the latest received data, making it more responsive to price changes.
Moving Averages are lagging indicators and don't provide 100% accurate signals. It's better to combine them with other technical indicators.
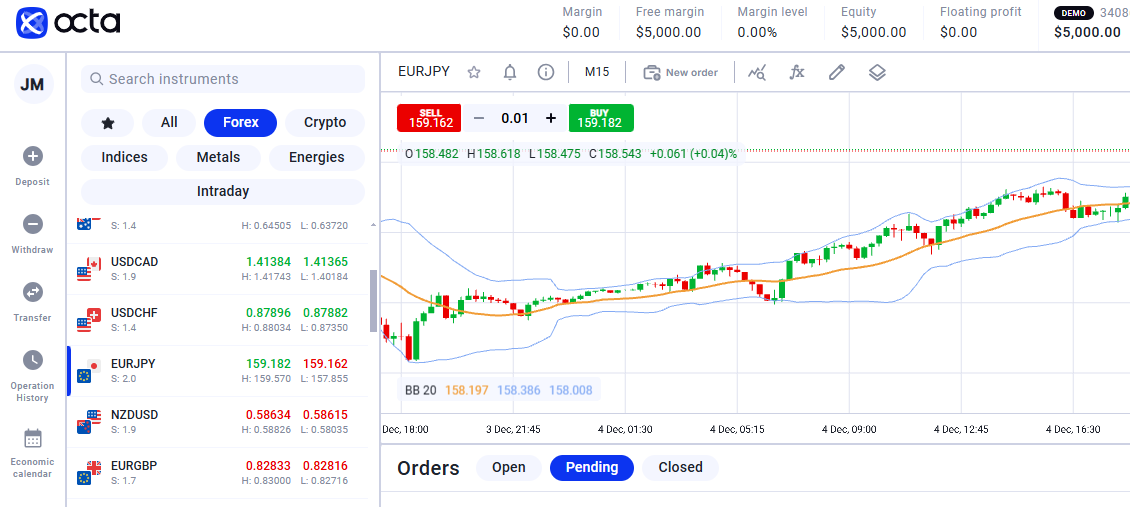
Bollinger Bands
American analyst John Bollinger created this support resistance indicator in the 1980s. It helps traders estimate an asset's volatility and provides market players with visual signals for entry and exit points. Bollinger Bands are based on a Simple Moving Average (SMA) for a specific timeframe, usually 20 days.
Bollinger Bands consist of three main components:
- Upper Band. It's the Moving Average increased by two standard deviations. This level demonstrates how high the asset price can rise.
- Middle Band. The Middle Band displays the current trend. If the price is above the Moving Average, it signals a bullish trend (uptrend). If the price is lower, it signals a bearish trend (downtrend).
- The Lower Band is the Moving Average reduced by two standard deviations. It indicates the lower limit below which the asset price may fall.
There are several ways to apply Bollinger Bands, such as trading on reversals, trading on trends, filtering trading signals, or adapting to different timeframes.
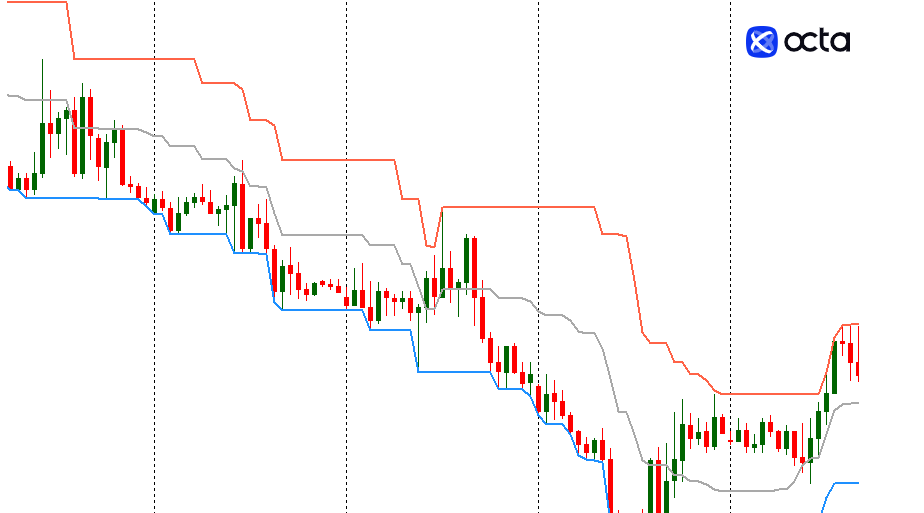
Donchian Channels
The technical indicator developed by Richard Donchian is used to assess market volatility. Donchian channels also have three bands:
- Upper Band—the maximum price over a specific timeframe.
- Lower Band—the minimum price for the same period.
- Middle Band—the Moving Average between the Upper and Lower Bands. This is an additional element in the analysis.
When the price breaks through the Upper Band, it signals the start of an uptrend. A breakdown of the Lower Band indicates the beginning of a downtrend.
The width of the channel shows the level of market volatility. Wide channels mean high volatility, and narrow channels mean low volatility.
Fibonacci Retracements
Fibonacci retracements, also known as fibs levels, are one of the popular technical analysis indicators used by traders. The fibs are vital since they provide key areas that the market might retrace. The key levels used by traders are 61.8%, 38.2 %, and 50% retracements.
To draw Fibonacci levels, the trader identifies the low and then the high in a bullish market. The Fibs drawn (61.8%, 50%, 38.2%, etc.) indicate the key areas that traders anticipate pulling back to.
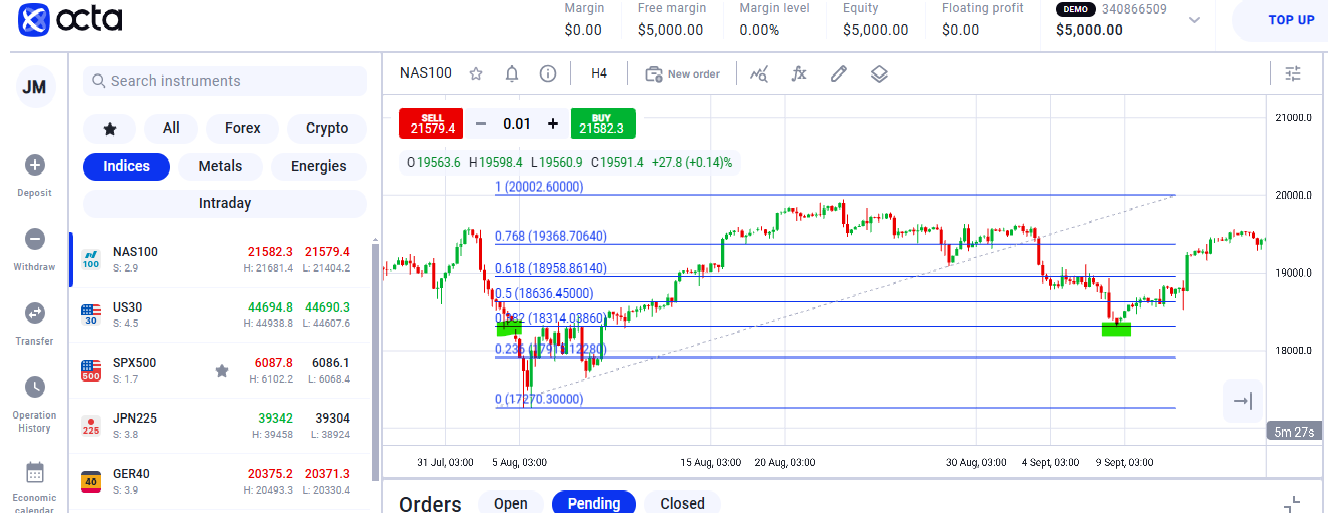
As indicated above, the 32.8% level acted as a support level in the bullish market.
Support and resistance strategies
Indicators provide only visual clues about where support and resistance levels may be located. Strategies, in contrast, require the trader to participate actively in the analysis. When applying them, traders study price charts and consider contextual features: trading volume, technical formations, recent news, etc. As a result, they make more informed decisions based on the overall picture of the market, not just the numerical values of the indicators.
Breakouts
The breakout method uses sharp price movements when the price breaks through predetermined support or resistance levels.
How to apply the strategy:
- Identify the levels. First, identify the support and resistance levels: trend lines, Moving Averages, etc.
- Monitor breakdown signals. Wait for the price to break out the resistance or support levels.
- Retest. Wait for a pullback to retest the key area to bounce off after the breakout.
- Wait for the signals to be confirmed. Look for confirmations, such as a candle pattern or the use of oscillators, such as RSI, to enter the trade.
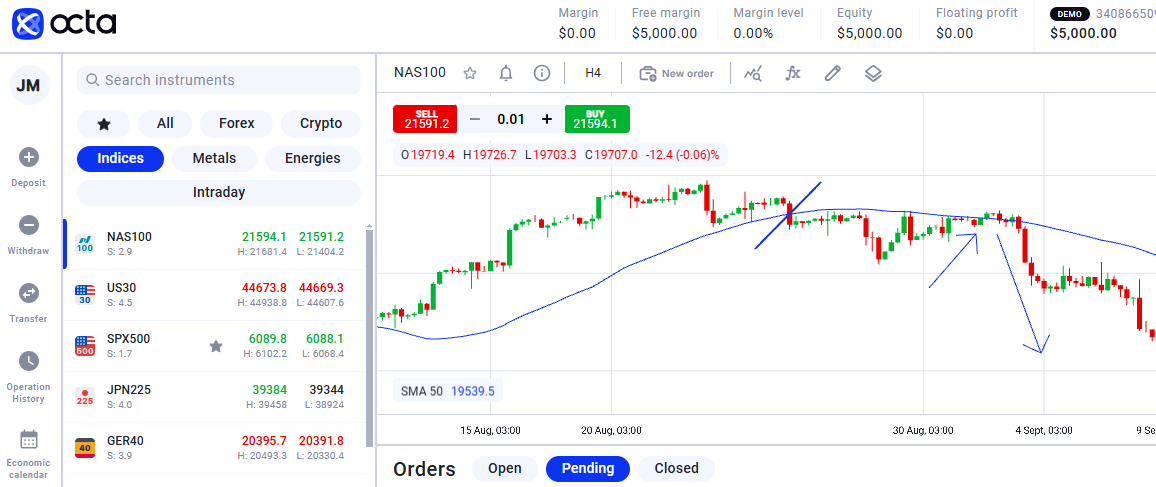
The example above shows the breakout strategy; the price crossed over 50 MA and returned to bounce.
Channel strategy
The channel strategy is based on simple price channels. This technical tool helps traders analyse price dynamics within a specific timeframe.
How to apply the strategy:
- Select the timeframe. Set a time interval (1 hour, day, week, etc.), depending on your trading style.
- Find the highs and lows. Determine the nearest support (lows) and resistance (highs) levels. Connect them with parallel lines to mark the upper and lower boundaries of the channel.
- Check the stability of the line. Ensure both lines reflect several price points.
- Determine the trend direction. If the channel is ascending, it is a bullish trend; if it is descending, it is a bearish trend.
- Pay attention to the volume of trade. Changes in trading volumes confirm the strength of the price movement. The volume increase at the level's breakdown confirms the potential for continued movement in a given direction.
- Open a long or a short position. To protect your capital, set stop losses and don't risk more than 1–2% of your trading budget per deal.
- Keep monitoring the positions. Evaluate the price behaviour and be prepared to adapt. If the price shows signs of a reversal or channel breakdown, consider partially exiting or closing the entire position.
The channel strategy is simple to understand and use, so it's suitable for both beginners and experienced traders.
Reversals
The reversals strategy allows traders to profit from changes in price direction. Traders who use this method expect a reversal after a prolonged price movement (either upward or downward).
How to apply the strategy:
- Identify the reversal levels. Detect the critical support and resistance levels on the chart. These levels can be potential pivot points. For clarity, use horizontal lines to mark the price's historical highs and lows.
- Analyse the price actions. Determine when the price approaches the support or resistance level and observe how it behaves near these levels. Often, a reversal is accompanied by several patterns, such as a Hammer or Absorption candle.
- Apply technical indicators. To confirm reversal signals, use technical indicators such as the Relative Strength Index (RSI), Stochastic Oscillator, etc. For example, if the RSI values are above 70, it signals overbought.
- Open a position. Once you've detected a reversal signal, open a position.
- Exit the trade. If the price has reached your target profit level, you profit. If the market starts moving against you, consider closing the position to avoid significant losses.
The reversal strategy can be adapted to both short-term and long-term charts. If you apply it correctly, you can get significant profitable trades. For this, learn how to work with technical indicators, recognise reversals on charts, and distinguish false reversals from real ones.
Final thoughts
- Support and resistance indicators are not just graphical lines on a chart. They are practical technical tools that help traders recognise the levels where the price may reverse or slow down.
- You can use Moving Averages, Bollinger Bands, Donchian Channels, Fibonacci Retracements, and other indicators to identify support and resistance levels.
- For example, the channel strategy involves identifying price channels to analyse trends and make trading decisions. The reversal strategy allows traders to profit from expected changes in price direction after prolonged movements.
- Each strategy requires careful analysis of price behaviour, volume, and confirmation signals to minimise risks and maximise potential profits.
- The skilful use of the indicators can turn random trades into consistent successes in Forex trading.
